
Cortex is live.
For ten years the same conversation has repeated itself in different rooms. A database has grown past the disk it sits on. A server is two versions behind and nobody noticed until support ended. An analytics workspace has quietly run out of capacity halfway through a reporting cycle. Every one of these was visible weeks before it mattered, in a log or a portal or a dashboard that nobody had reason to open that day.
That is the problem Cortex exists to solve. Not another monitoring tool that tells you a server is down, but a vantage point that tells you what is drifting while there is still time to do something ordinary about it.
What it actually does
Cortex watches the platforms you already run and answers three questions.
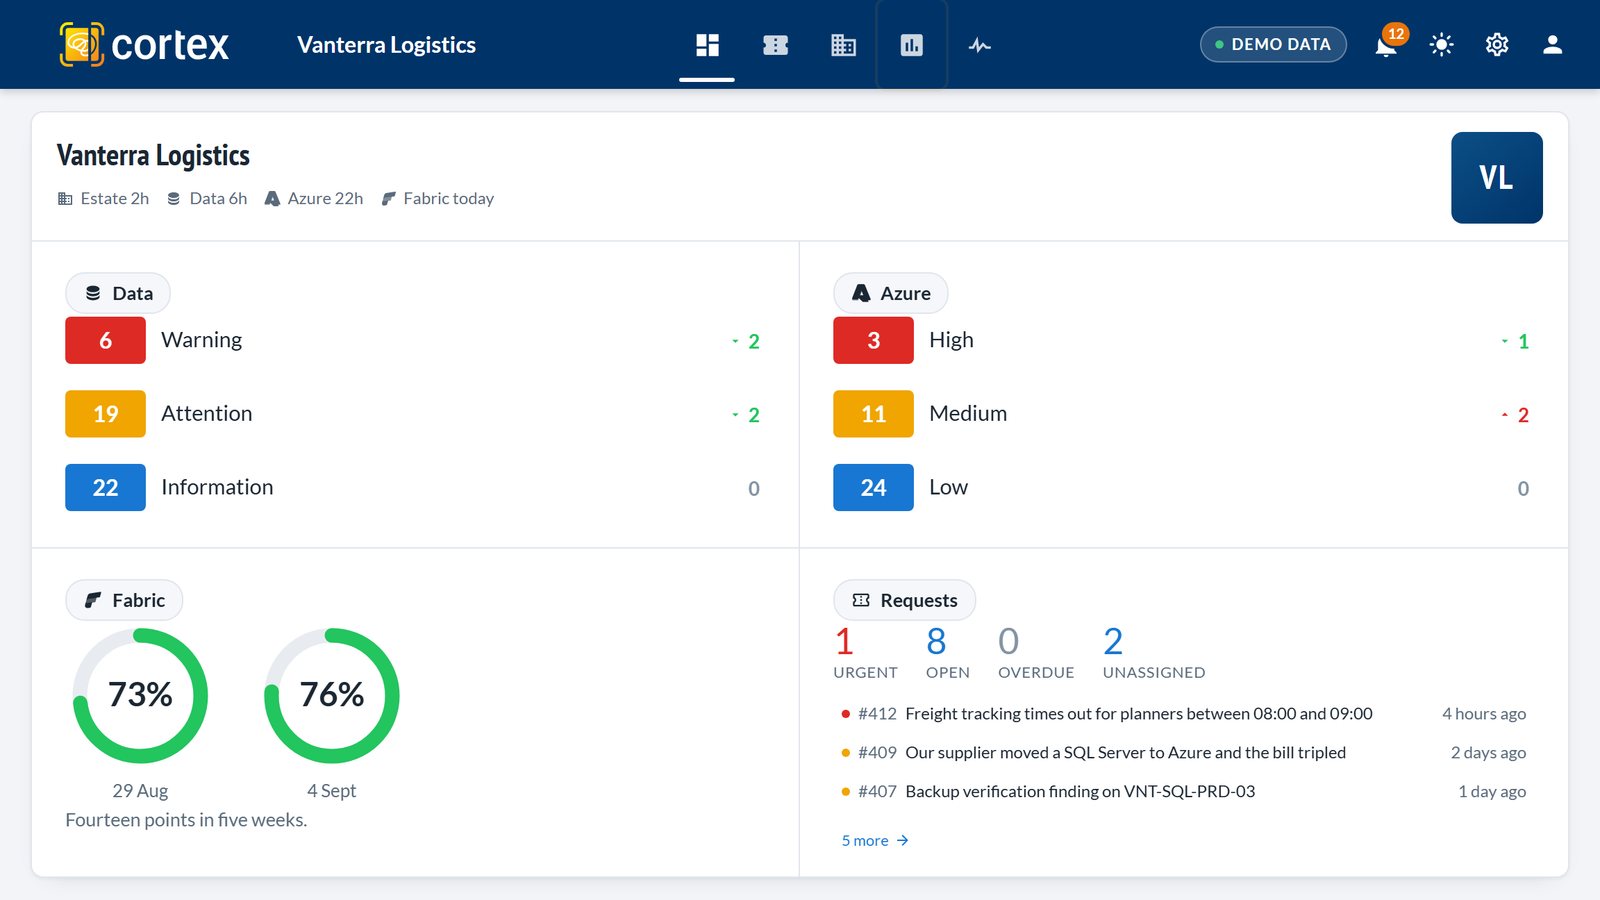
What have I got? Every server, database and workspace in one inventory, with its version, its support status and what changed since last week. Not a diagram someone drew eighteen months ago, but what is running right now.
Is it healthy? Health checks and best practices measured over time rather than at a single moment. A snapshot tells you a database passed a check on Tuesday. A trend tells you it has been getting slowly worse since June, which is the thing worth knowing.
What is about to hurt? Early warnings for the things that quietly become emergencies: growth, patch levels, backups, capacity. These are the failures that arrive with weeks of notice and still surprise everyone.
Why one product across three domains
Most tools in this space pick a lane. There are database monitors, cloud governance dashboards and analytics capacity planners, and they each do their job well while knowing nothing about the other two.
That split does not match how anything actually breaks. A report fails because a workspace ran out of capacity, because a dataset grew, because a database was never archived, because nobody owned the retention policy. Four causes, one incident, and four tools that each saw only a fragment.
Cortex covers the estate, the databases and the analytics workspaces in one view, because that is the shape of the problem. It comes out of the same three practices we already run: DevOps for the environment, Data for what sits inside it, and Analytics for what people build on top.
We see the same screen you do
The shared view matters more than any individual feature. When we work with you, we are not reading a report you exported and emailed us last month. We are looking at the same view, at the same time.
That changes the conversation. Instead of asking what your estate looks like, we can ask why that one server has drifted from the baseline, and act on it before it turns into an evening.
A decade, condensed
Nothing in Cortex is a guess about what might be useful. Every check in it exists because it caught something real, on somebody's platform, in an engagement where it mattered. The tool is what happens when you spend ten years fixing the same categories of problem and finally write down everything you learned to look for.
That is the whole idea. The expertise does not sit in a consultant's head any more, available when we happen to be on site. It runs continuously, and it tells you what it sees.
See it for yourself
There is an interactive demo on the Cortex page, running in your browser with nothing to install. If you would rather see it against your own questions, book a walkthrough and we will show you the real thing.
If you are not sure where you stand yet, the Health Check is the honest place to start. It gives you a baseline, and Cortex is what keeps that baseline current after we leave.